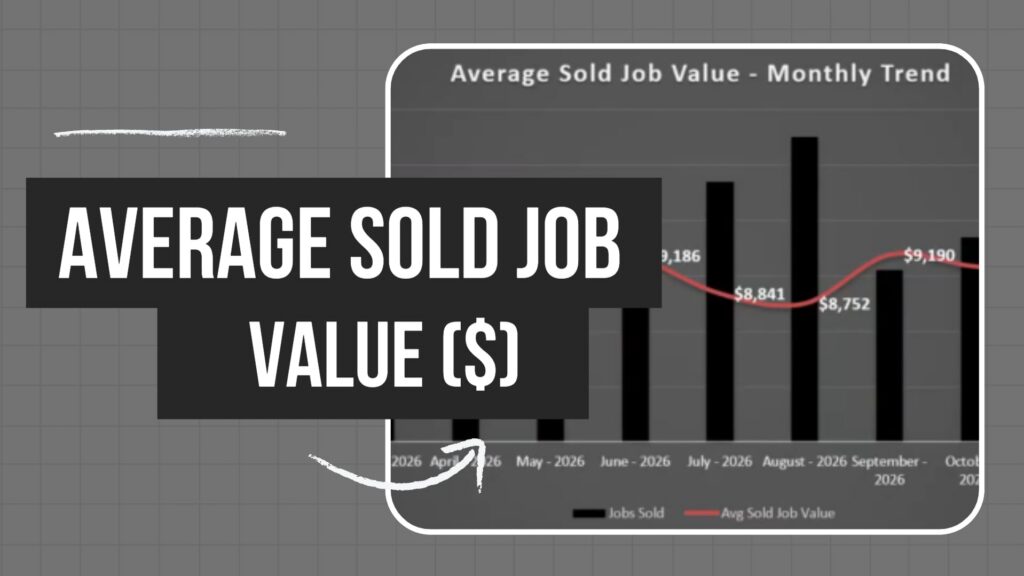
Examine average sold job value to quickly see how much revenue each sale generates and where pricing or sales approach may be limiting overall deal size.
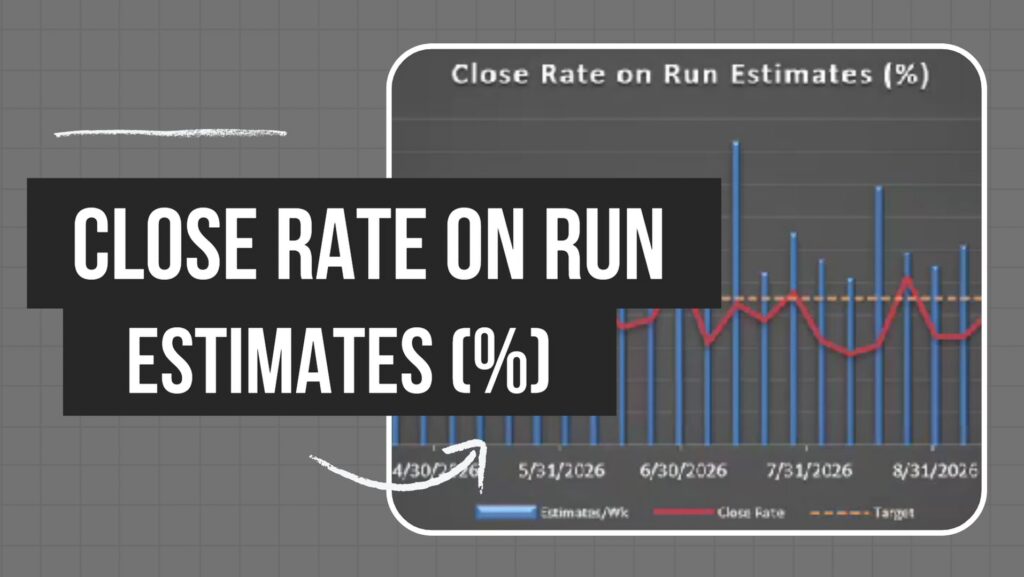
Review close rate on run estimates to uncover how effectively field opportunities convert into sales and where approach or positioning may affect outcomes.
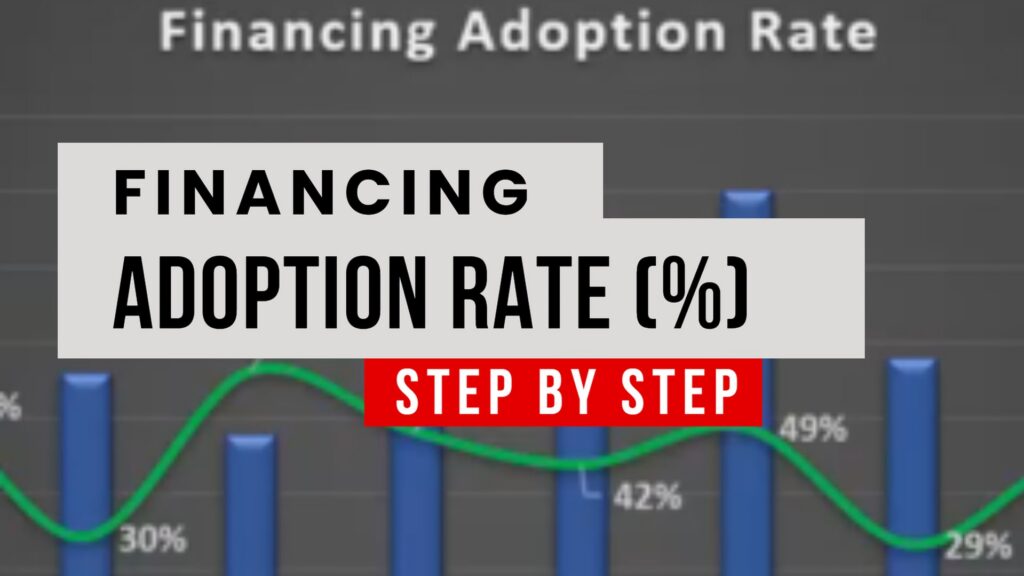
Assess financing adoption rate to highlight how frequently customers use payment plans and where offering flexibility may boost conversion and deal size.
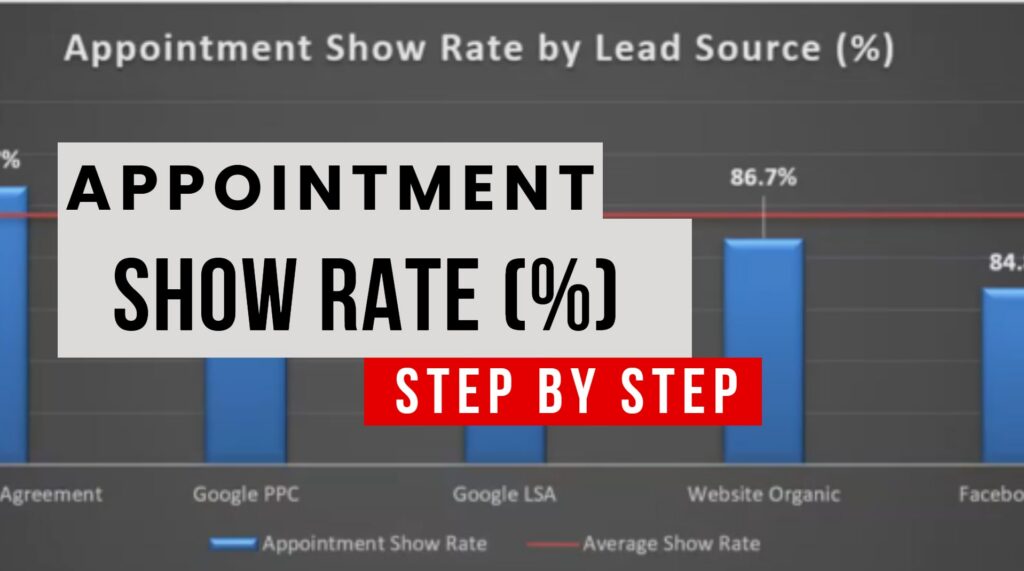
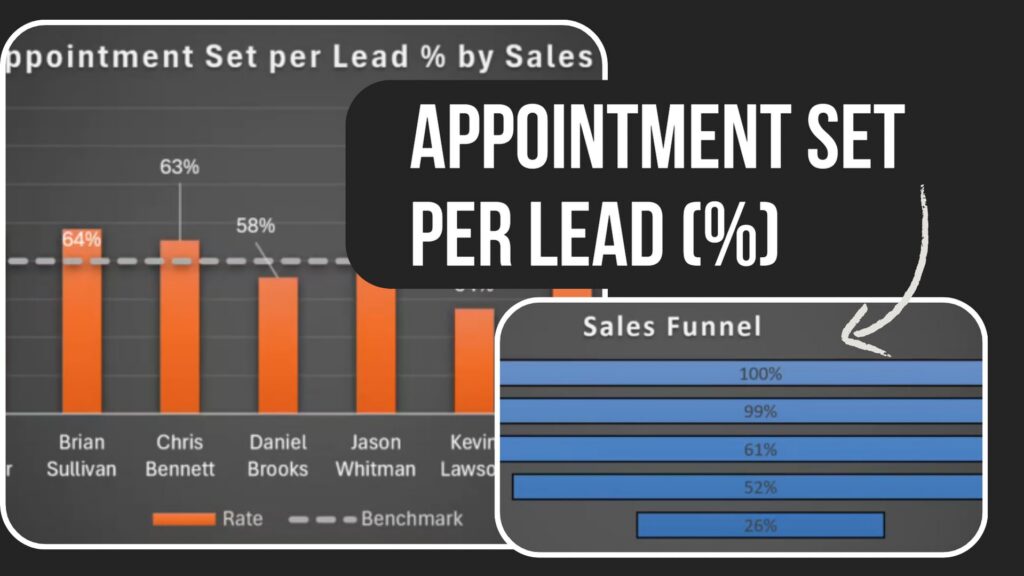
Measure appointment set per lead to understand how effectively inquiries turn into scheduled visits and where lead handling may be impacting conversion rates.
Analyze contact to close rate to highlight how many conversations result in completed transactions and where conversion gaps may be affecting overall sales outcomes.
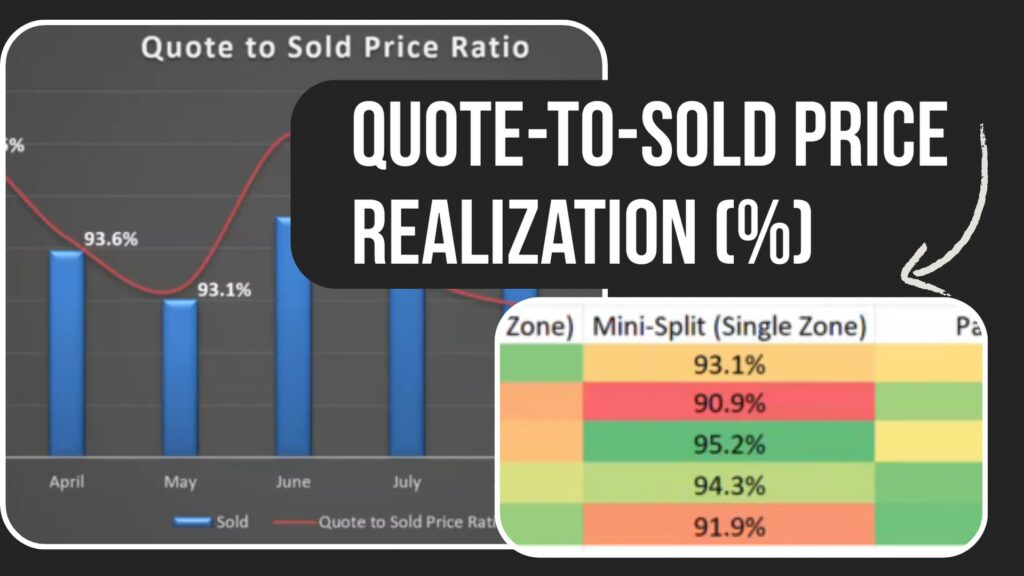
Benchmark quote-to-sold price realization to highlight how closely final pricing aligns with initial quotes and where discounting may be affecting revenue capture.
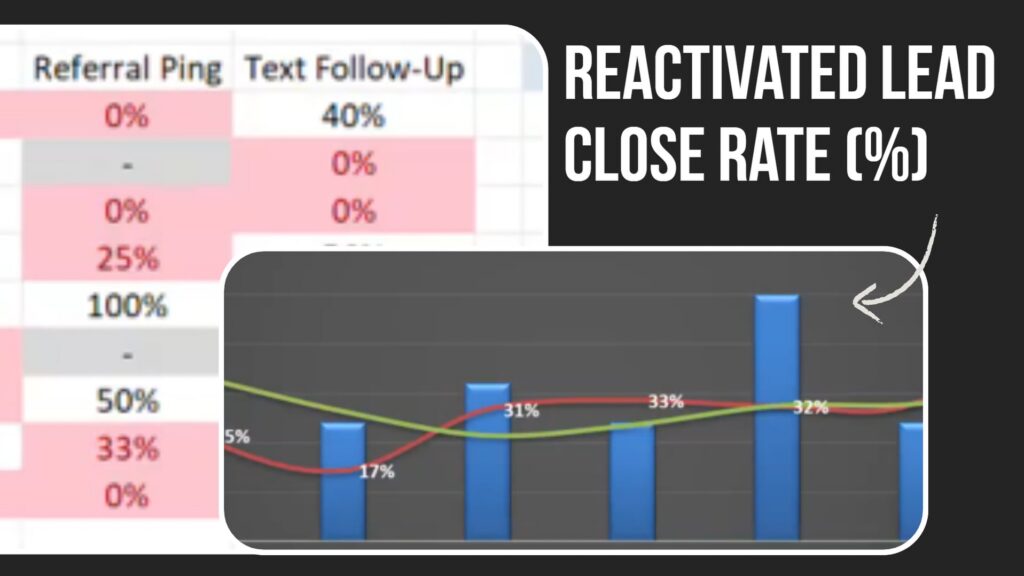
Uncover reactivated lead close rate to highlight how effectively dormant prospects are converted into buyers and where re-engagement efforts may be driving additional revenue.
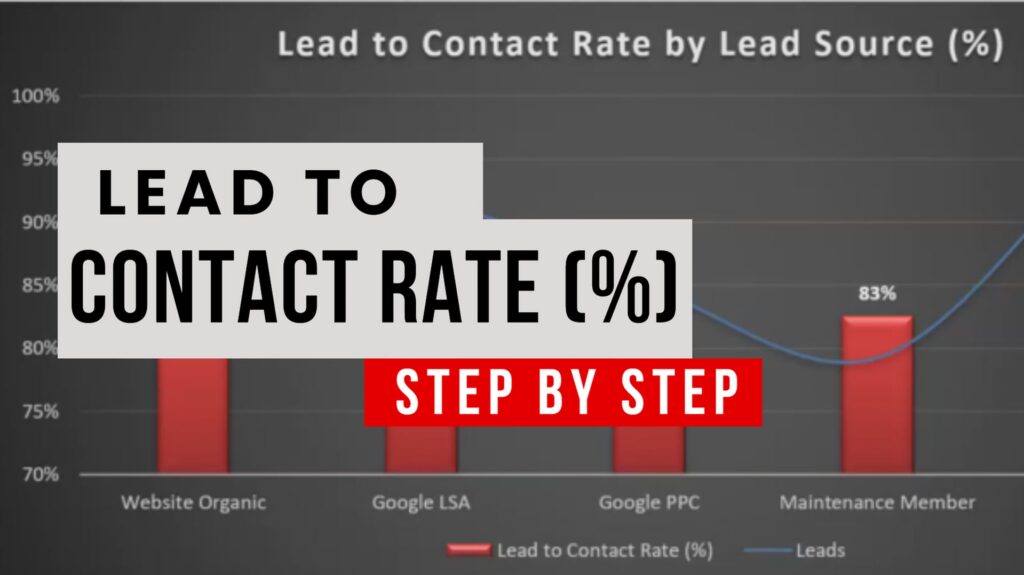
Gauge lead to contact rate to understand how many inquiries receive initial outreach and where response speed or outreach efforts may influence engagement levels.
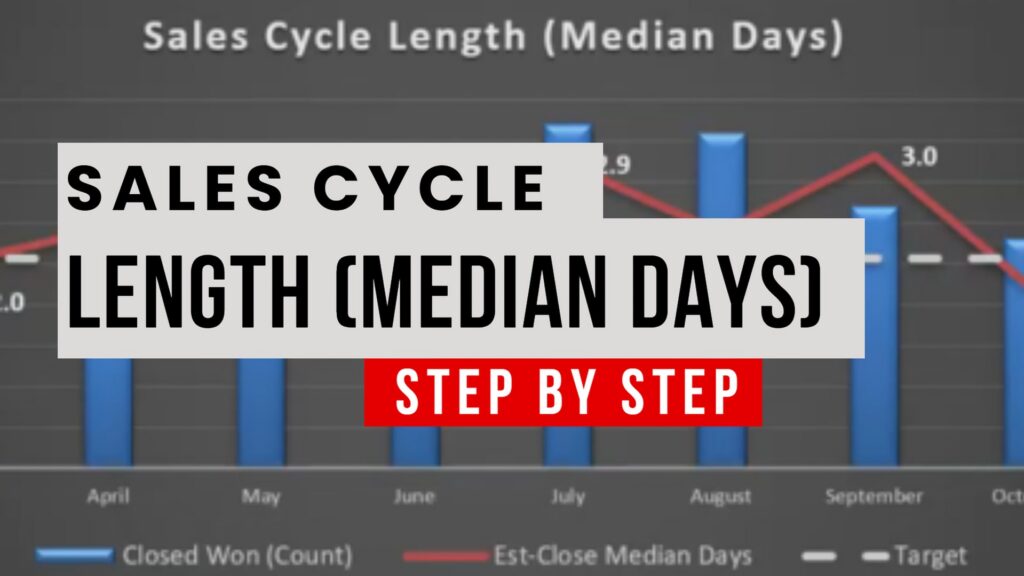
Determine median speed to first contact to highlight how quickly new inquiries receive attention and where slower responses may reduce early conversion potential.
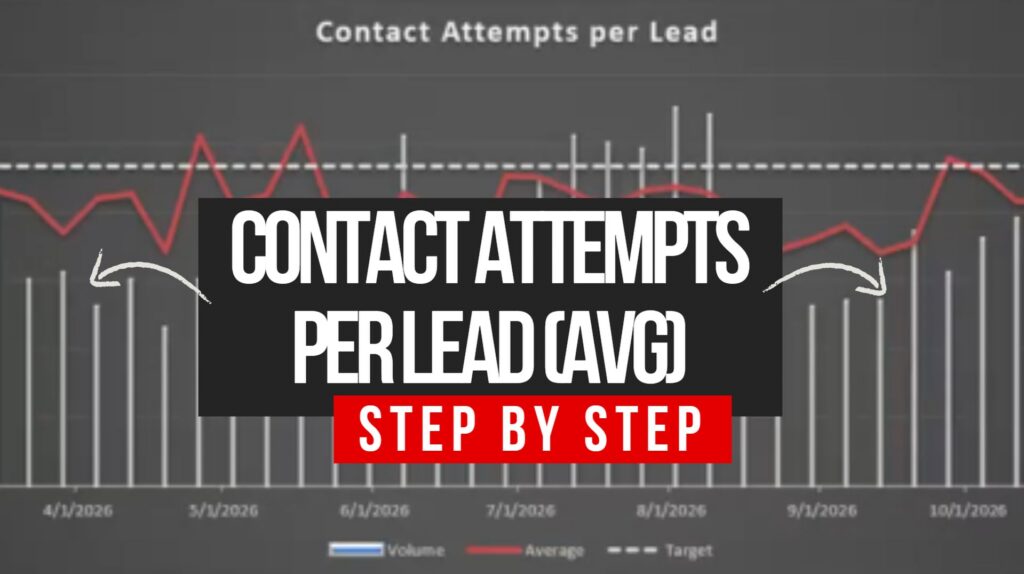
Track average contact attempts per lead to highlight outreach intensity and where persistence levels may influence connection success and engagement rates.
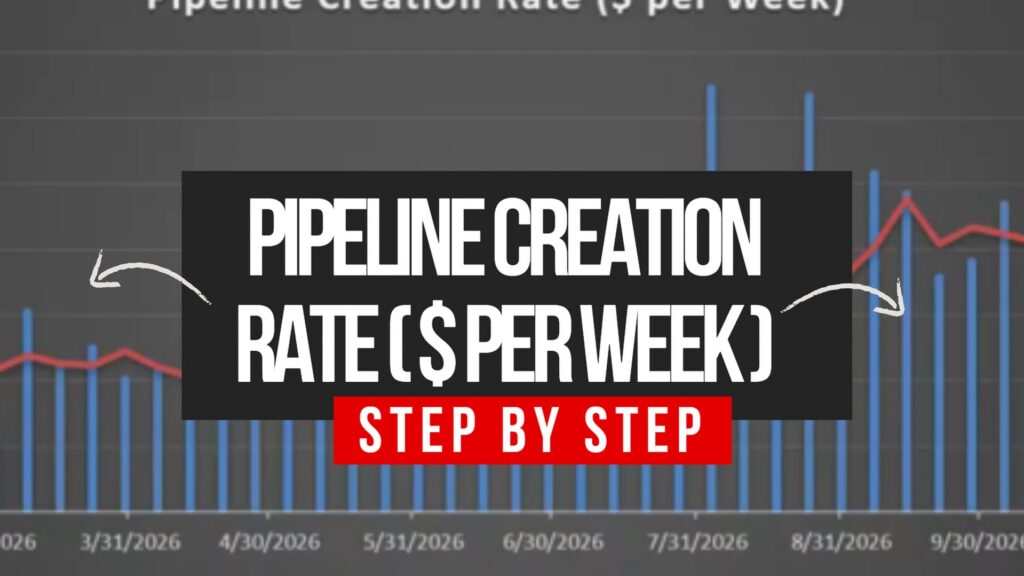
Monitor pipeline creation rate to evaluate how much new opportunity value is generated each week and where prospecting efforts may influence future revenue growth.
Compare pipeline coverage ratio against targets to reveal whether upcoming opportunities are sufficient to meet short-term goals and where gaps may require additional focus.
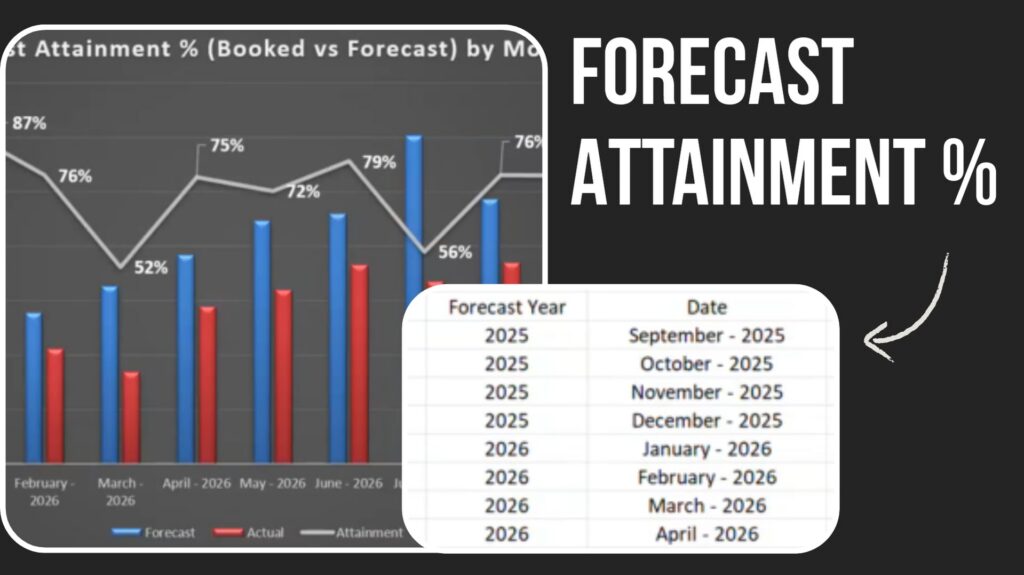
Compare forecast attainment percentage against booked results to reveal how accurately projections align with actual performance and where adjustments may be needed.