HVAC Inventory KPI Video Library

Browse 20 inventory KPIs with step-by-step Excel build videos and supporting charts for each metric.

Need help making sense of your HVAC data?

Revenue Lost to Stockouts %

Minimize revenue lost to stockouts percentage to capture how often missed inventory prevents sales and where supply planning may recover lost income.

First-Time Fix Rate Impacted by Parts %

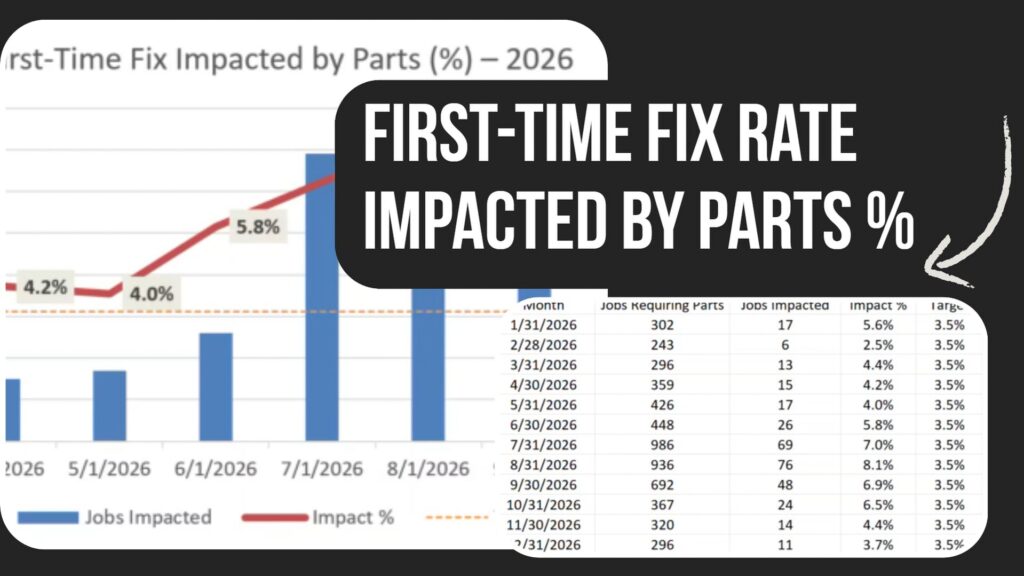
Improve first-time fix rate impacted by parts percentage to measure how often parts availability affects job completion and where inventory gaps may be reducing service effectiveness.

Dead Stock %

Reduce dead stock percentage to show how much inventory remains unused and where purchasing or demand planning may be misaligned.

Stockout Rate %

Lower stockout rate percentage to indicate how often items are unavailable and where inventory planning may be failing to meet demand.

Inventory Carrying Cost

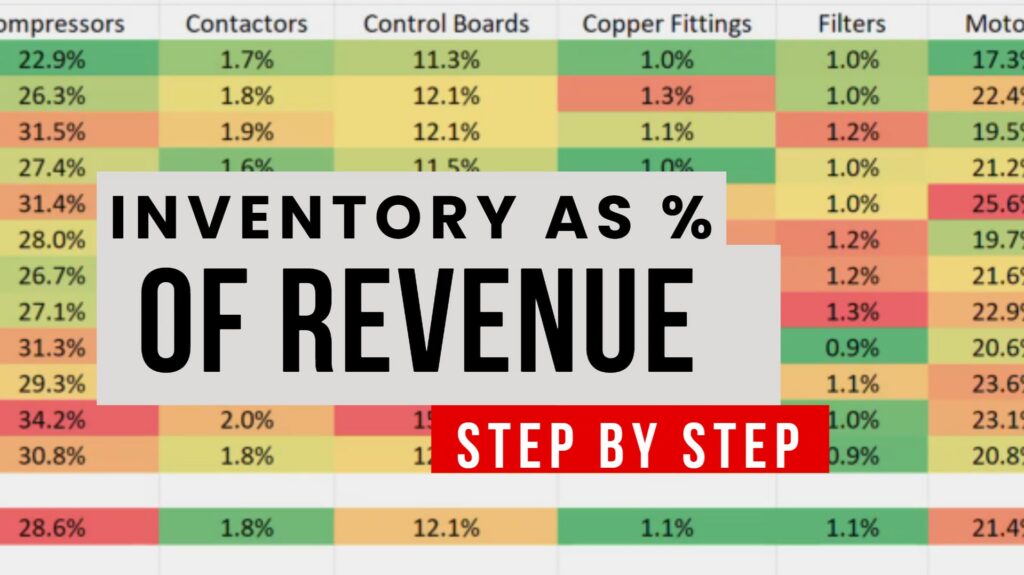
Manage inventory carrying cost to reflect how much capital is tied up in stock and where storage, obsolescence, or excess levels may be increasing expenses.

Inventory as % of Revenue

Monitor inventory as a percentage of revenue to see how much capital is tied up in stock and where balance may be needed between supply and sales.

Backorder Rate %

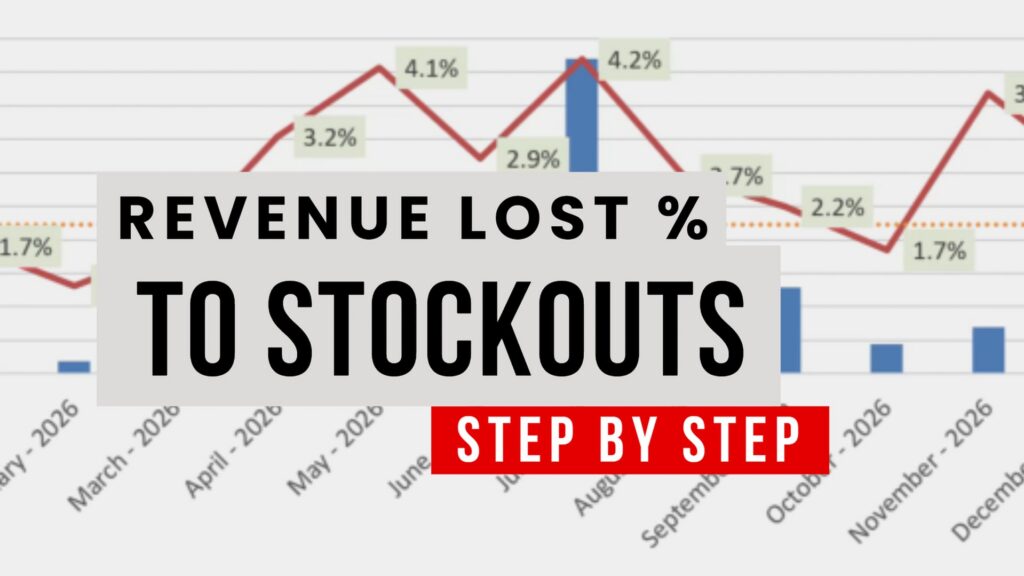
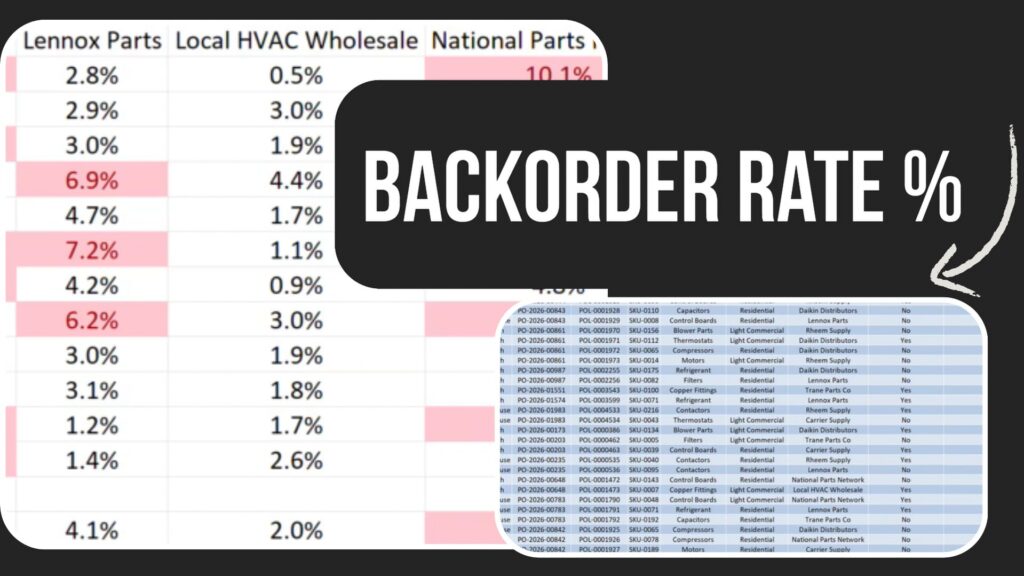
Decrease backorder rate percentage to indicate how often orders cannot be fulfilled on time and where supply chain gaps may be impacting service delivery.

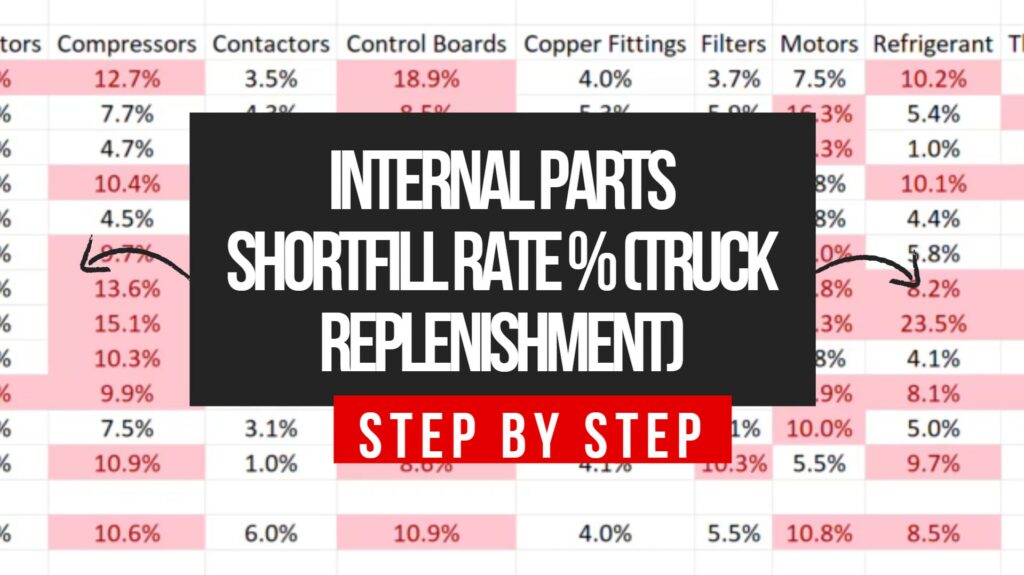
Internal Parts Shortfill Rate % (Truck Replenishment)

Improve internal parts shortfill rate percentage to reflect how often replenishment orders are incomplete and where stocking processes may be falling short.

Inventory Accuracy %

Increase inventory accuracy percentage to ensure recorded stock matches actual counts and where discrepancies may disrupt operations.

Shrinkage % (Loss / Damage / Theft)

Reduce shrinkage percentage to quantify losses from damage, theft, or errors and where controls may need strengthening.

Supplier Fill Rate %

Improve supplier fill rate percentage to measure how reliably vendors fulfill orders and where sourcing performance may need improvement.

Late Delivery % of Spend (Weighted)

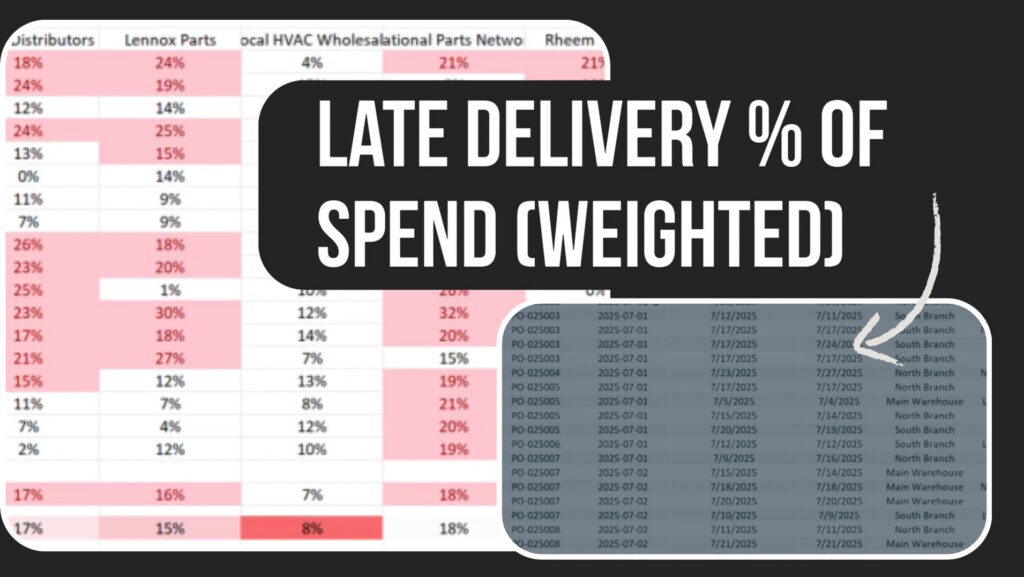
Reduce late delivery percentage of spend to assess how much purchasing is affected by delays and where supplier reliability may be impacting operations.

Order Cycle Time (Days)

Shorten order cycle time in days to indicate how quickly orders move from placement to delivery and where process delays may be slowing fulfillment.

Inventory Turnover Ratio

Increase inventory turnover ratio to show how efficiently stock is sold and replaced over time and where excess inventory may be reducing performance.

Days of Inventory on Hand (DOH)

Reduce days of inventory on hand to indicate how long stock remains before being used or sold and where inventory levels may be higher than needed.

Slow-Moving Inventory %

Decrease slow-moving inventory percentage to signal how much stock lingers without usage and where demand alignment or purchasing may need adjustment.

Cycle Count Accuracy %

Improve cycle count accuracy percentage to ensure counted inventory matches system records and where discrepancies may be affecting reliability.

Median Lead Time (Days)

Shorten median lead time in days to indicate how long it takes to receive goods and where supplier or ordering delays may impact availability.

Supplier Defect Rate %

Lower supplier defect rate percentage to measure how often received items fail quality standards and where vendor performance may need improvement.

Purchase Cost Variance %

Control purchase cost variance percentage to compare actual prices against expected costs and where procurement efficiency may be slipping.

Databoards

Analysis & Development